# Install and load libraries.
library(xlsx)
## Loading required package: rJava
## Loading required package: xlsxjars
library(ggplot2)
# Question 1
# Load Daphne Island data.
daphne.island <- read.xlsx("Homework 2 Data.xlsx", 1, header = FALSE)
daphne.island
##      X1    X2    X3    X4   X5
## 1  8.65 10.61 10.89  8.42 9.73
## 2  9.05  8.94 11.29  9.52 8.47
## 3 10.52 10.25  9.55  8.62 9.68
## 4  8.89 10.25  9.24 11.53 9.59
## 5  8.67  9.98 10.54 10.26 9.43
# Load Santa Cruz data.
santa.cruz <- read.xlsx("Homework 2 Data.xlsx", 2, header = FALSE)
santa.cruz
##      X1    X2    X3    X4    X5    X6    X7    X8    X9
## 1 12.66 12.35 10.88 11.29  8.47 10.52 11.01 10.46 11.78
## 2 11.04 11.56 10.33 10.62 10.43  9.74 10.02 10.91 10.30
## 3 10.82 11.07 10.21 10.49 12.09 13.25  8.73 10.27 11.82
## 4 13.49 10.65 10.68  9.99 10.24  9.47 10.18  9.81    NA
## 5 11.10 10.05 10.55 11.32 10.85  9.42 11.26 10.94    NA
# Display summaries for each island side-by-side; ignore 'NA' values where possible.
options(digits = 4)
finch.summary <- matrix(c((length(unlist(daphne.island)) - length(which(is.na(daphne.island)))),
                          (length(unlist(santa.cruz)) - length(which(is.na(santa.cruz)))),
                          mean(unlist(daphne.island)), mean(unlist(santa.cruz), na.rm = TRUE),
                          summary(unlist(daphne.island))[[3]], summary(unlist(santa.cruz))[[3]],
                          sd(unlist(daphne.island), na.rm = TRUE), sd(unlist(santa.cruz), na.rm = TRUE),
                          min(unlist(daphne.island), na.rm = TRUE), min(unlist(santa.cruz), na.rm = TRUE),
                          summary(unlist(daphne.island))[[2]], summary(unlist(santa.cruz))[[2]],
                          summary(unlist(daphne.island))[[5]], summary(unlist(santa.cruz))[[5]],
                          max(unlist(daphne.island), na.rm = TRUE), max(unlist(santa.cruz), na.rm = TRUE)),
                        ncol = 2, byrow = TRUE,
                        dimnames = list(c("Size", "Mean", "Median", "Std. Dev.", "Minimum", "First Quartile",
                                          "Third Quartile", "Maximum"),
                                        c("Daphne Island", "Santa Cruz")))
finch.summary
##                Daphne Island Santa Cruz
## Size                 25.0000     43.000
## Mean                  9.7028     10.770
## Median                9.5900     10.650
## Std. Dev.             0.8894      1.024
## Minimum               8.4200      8.470
## First Quartile        8.9400     10.225
## Third Quartile       10.2600     11.180
## Maximum              11.5300     13.490
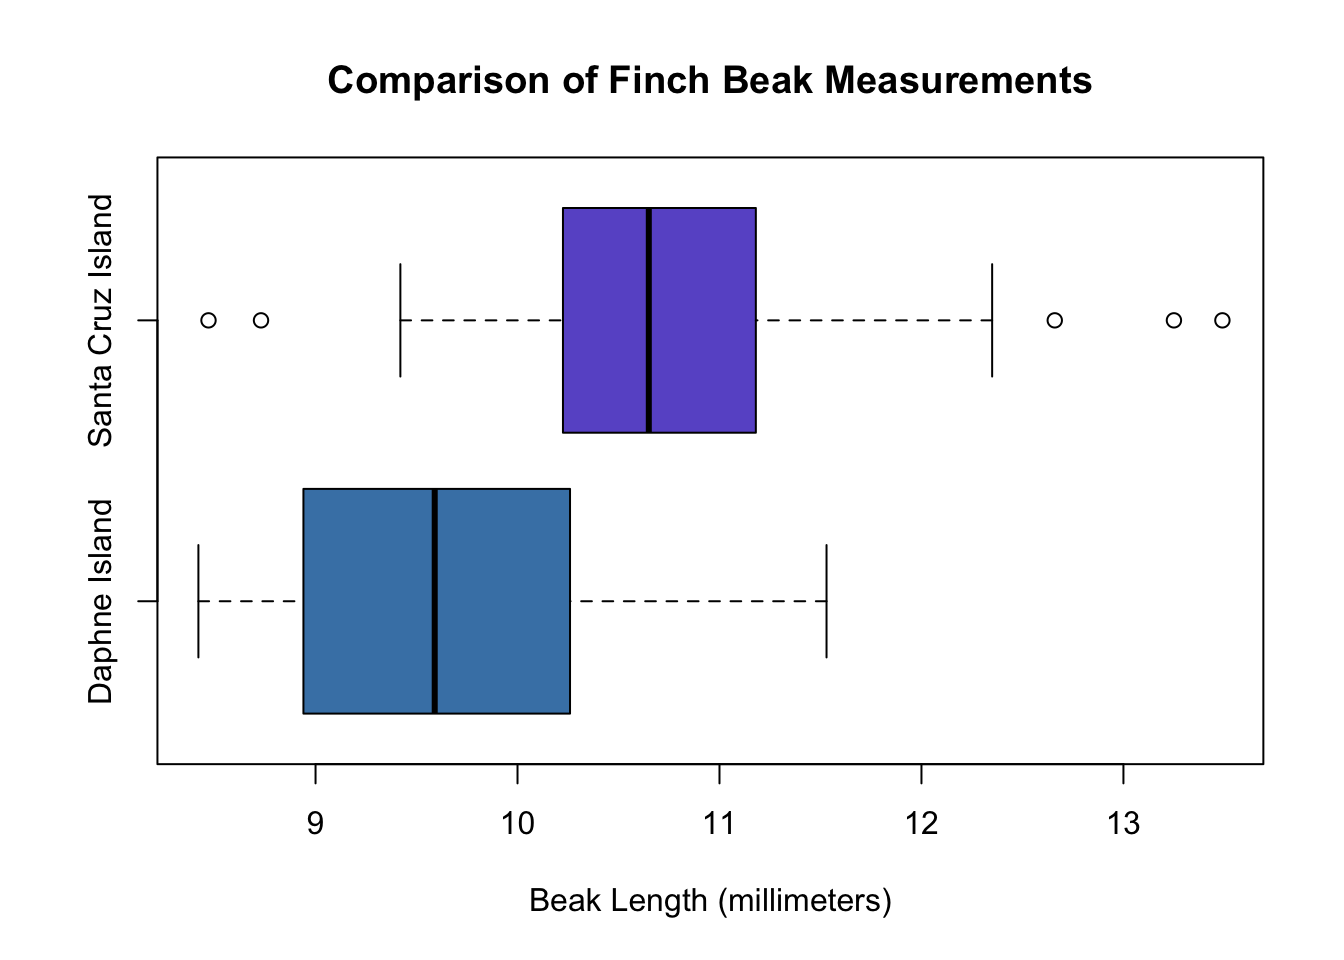
# Display graphs for each island's beak size distribution; use built-in boxplot function.
boxplot(unlist(daphne.island), unlist(santa.cruz), horizontal = TRUE,
        main = "Comparison of Finch Beak Measurements",
        names = c("Daphne Island", "Santa Cruz Island"),
        xlab = "Beak Length (millimeters)",
        col = c("steelblue", "slateblue"))
# Question 2
# Test if Daphne Island finch beak measurements differ from 10 mm.
t.test(unlist(daphne.island, use.names = FALSE), mu = 10, alternative = "two.sided")
##
##  One Sample t-test
##
## data:  unlist(daphne.island, use.names = FALSE)
## t = -1.7, df = 24, p-value = 0.1
## alternative hypothesis: true mean is not equal to 10
## 95 percent confidence interval:
##   9.336 10.070
## sample estimates:
## mean of x
##     9.703
# Question 3
# Find confidence interval of mean Daphne Island finch beak measurement using 90% confidence.
t.test(unlist(daphne.island, use.names = FALSE), conf.level = 0.90)
##
##  One Sample t-test
##
## data:  unlist(daphne.island, use.names = FALSE)
## t = 55, df = 24, p-value <2e-16
## alternative hypothesis: true mean is not equal to 0
## 90 percent confidence interval:
##   9.398 10.007
## sample estimates:
## mean of x
##     9.703
# Question 4
# Test if Daphne Island finch beak measurements are smaller than Santa Cruz Island finches.
t.test(unlist(daphne.island), unlist(santa.cruz), conf.level = 0.95, alternative = "less")
##
##  Welch Two Sample t-test
##
## data:  unlist(daphne.island) and unlist(santa.cruz)
## t = -4.5, df = 56, p-value = 2e-05
## alternative hypothesis: true difference in means is less than 0
## 95 percent confidence interval:
##     -Inf -0.6716
## sample estimates:
## mean of x mean of y
##     9.703    10.770